Your boss is preparing a presentation he is giving to the board of directors and he needs to know how your marketing efforts from the prior year have impacted the company's bottom line. He wants to know:
-
What sources are bringing in the most revenue?
-
How many qualified opportunities are we creating through our digital marketing efforts?
-
What sources are generating the most qualified opportunities?
-
Which marketing assets are performing attracting the most leads?
-
What touch points in the customer journey are most effective?
Are you prepared to answer these?
Having these metrics readily available can help you not only prepare your reporting to executives but also help you learn about customers’ behavior. The more insights you gather about customers, the better you can market to them.
HubSpot Reporting: Begin with the end in mind
The key to generating the right reports in HubSpot is, to begin with, the end in mind in terms of what questions you really need to answer and setting up your data fields correctly to capture that data. You'll need to build the system and your reports to answer those questions accurately.
So what we're going to show you are the 5 reports that answer the 5 questions above. These are what your boss really wants.
1. WHICH SOURCES BROUGHT THE MOST REVENUE?
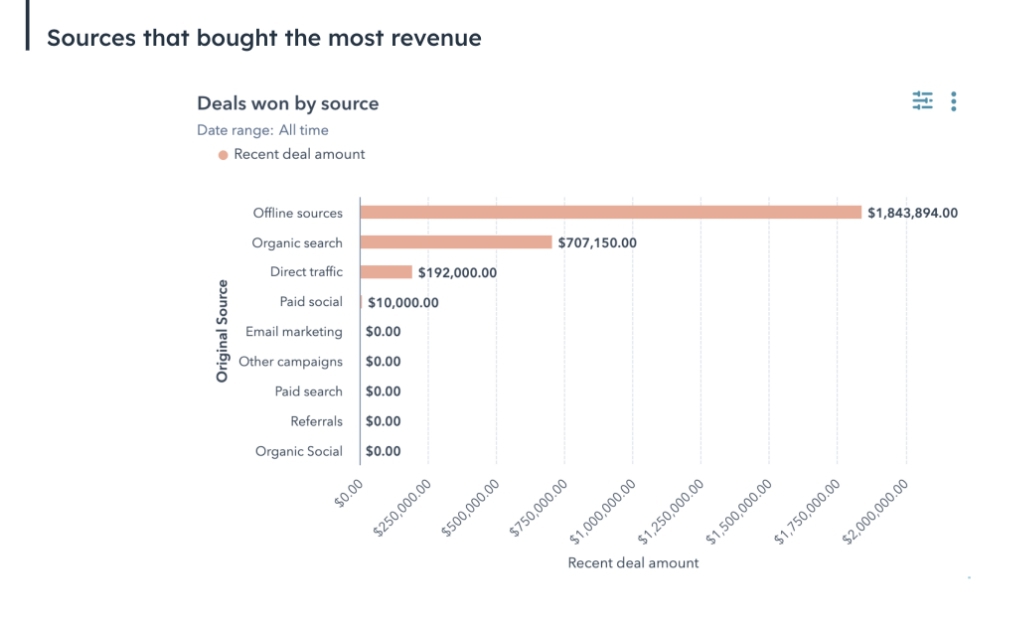
Boss: "Exactly how much money did I make this quarter? And where did those customers come from?"
You: “Here is the report Deal Revenue by Source.”
HubSpot automatically captures the lead source. The trick with this report is to connect the original source property with the revenue that was generated for that company in a specific period.
BREAKING Down Offline Sources?
You may see that the bulk of the revenue is coming from offline sources (see example above). If this is the case, we recommend creating a second report that further breaks down the revenue from offline sources.
Offline sources typically include non-digital sources like trade shows or conferences. A source could even have originated at a coffee shop or at a social event.
Break down your offline sources so that you can attempt to accurately attribute leads to those sources. After all, tradeshows and conferences are marketing campaigns too and should be captured as such in HubSpot. It may take more time to set up your HubSpot properties to capture this level of detail but the extra work will pay off when you are able to show your boss exactly where revenue came from—and why that marketing effort was worth the time and money.
HubSpot Hack: If a large portion of your revenue comes from Offline Sources, set up your Original Source detail to specify different offline sources like trade shows and conferences.
2. WHAT PERCENTAGE OF LEADS GENERATED TURN INTO OPPORTUNITIES AND CUSTOMERS?
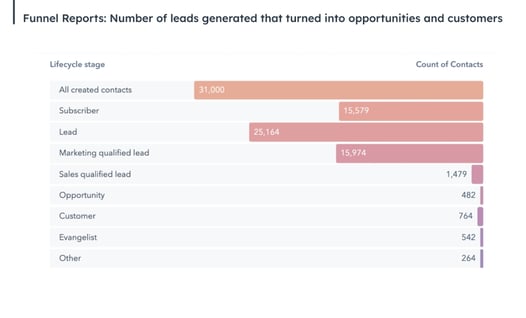
The next thing your boss wants to know is how many of the leads actually turned into opportunities and customers. To answer this, you will need to run a Funnel Report.
For example, you want to be able to show your boss that our digital marketing efforts generated 1,000 new leads this quarter, 10% of them became opportunities and 1% turned into customers.
Marketers often get tripped up by this report because they don't have an automated system that updates the contact's lifecycle stage as they move down the funnel. Many organizations choose to manually update this data and the manual updates don't always happen the way they should.
For example, a sales rep meets someone at a tradeshow and immediately records it in HubSpot as an opportunity. The rep usually won't go through the trouble of adding that person as a lead and then two minutes later changing it to an MQL, then an SQL, and then an opportunity. With this in mind, we suggest you use this report with a bit of a caveat. It is not the holy grail of reports.
Automating the Lifecycle Stage
We recommend automating this process as much as possible to keep the data as accurate as possible. For our clients, we usually set up workflows in HubSpot that will automatically change lifecycle stages.
For example, you could set it up so that any contact that is created by a sales rep is automatically tagged as an MQL, then, once the sales rep opens a deal with this MQL, the workflow automatically tags it as an opportunity.
The most important thing is to understand how your sales team actually works and set up HubSpot to capture that process in a way that keeps the data clean.
We recommend customising HubSpot's lifecycle stages to mirror your sales process. This ensures the terminology your sales team uses matches the lifecycle stages in HubSpot.
For instance, many companies add a lifecycle stage called "Sales Accepted Lead '' which is the stage between Marketing Qualified and Sales Qualified that indicates the sales team has accepted the lead and is working to qualify them.
3. WHICH SOURCES BROUGHT THE MOST OPPORTUNITIES/CUSTOMERS?
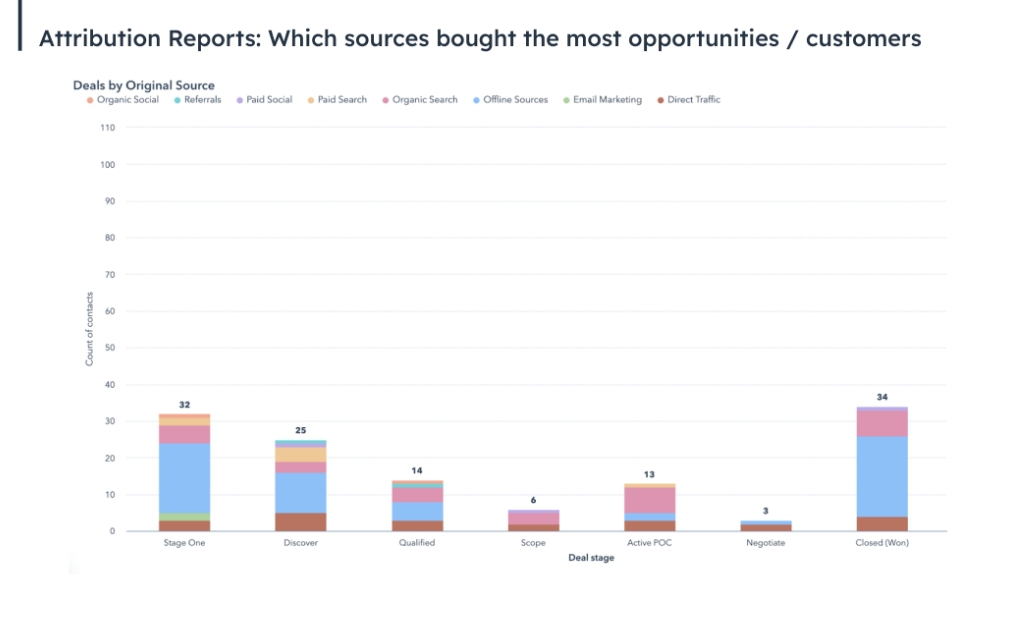
In addition to knowing how many leads became customers, your boss wants to know which sources brought the most opportunities and customers. Here we're looking at the channels you’ve invested in. Whether it’s LinkedIn, email, or Google, your boss wants to know which sources brought you the best opportunities and customers so you can justify your budget and get a better understanding of which channels to continue investing in.
This is where attribution reports come in.
Before you can start running your reports, you'll need to decide how you want to measure attribution. A good marketing strategy has multiple touchpoints.
For example, a lead might first interact with a blog and then receive a number of nurture emails and then finally download a whitepaper that inspires him or her to reach out to sales for a demo. In that case, which channel is responsible for generating that opportunity? Is it the blog (first interaction), the whitepaper (last interaction), or a mix of all of them? HubSpot generally has about seven different types of attribution models they allow you to use. Choosing the appropriate attribution model depends on what you're trying to measure.
Choosing the Right Attribution Model
How to choose the right attribution model:
First Interaction
This model attributes 100% of the contact credits to the contact's first interaction in the conversion path. Choose this model if:
You want to understand how people first discover your brand. For example, if you need to generate net-new business, this report will help you understand how your current customers first interacted with your content.
You want to generate leads and general brand awareness.
You close a high volume of deals, and your sales pipeline is about as wide at the top as it is at the bottom.
Last Interaction
This model attributes 100% of the contact credits to the contact's last interaction in the conversion path. Choose this model if:
You want to identify the value of actions taken at the bottom of the sales funnel.
You have a lot of leads but you close a low volume of deals. In this case, the model will show you which interactions are working at closing deals.
You want to better optimize the process of converting qualified leads into customers.
This model is not ideal for identifying which marketing assets and sales engagements are successfully moving leads through the entire pipeline.
Linear
This model attributes the contact credits equally to each interaction in the conversion path. Choose this model if:
-
You want a holistic view of all your marketing channels' performance
-
You want to assign credit to all assets that contacts interact with before they become a contact, have a deal associated with them, or have a closed deal.
This model is not ideal for identifying which campaigns or assets are more effective because all interactions get credited equally. For example, trade shows or highly- or hyper-segmented email campaigns will receive as much credit as when a prospect visits 20 web pages.
U-Shaped
This model attributes 40% of the contact credits to the first interaction and lead conversion interactions each. Then it attributes the remaining 20% evenly across all other interactions. Choose this model if:
-
You need to generate qualified prospects at the top of your funnel.
-
You want to build on an audience of leads to further nurture and qualify later.
This model is not ideal for middle or bottom-of-funnel marketers, as it ignores the interactions a contact took after being created.
W-Shaped
This model attributes 30% of the contact credits to the first interaction, 30% to the interaction that created the contact, and 30% to the last interaction that created the deal. It then attributes the remaining 10% evenly across all interactions between first and last. Choose this model if:
-
Your pipeline moves quickly from lead created or deals created to a customer.
-
You only have a few ways to convert qualified leads into customers, but you have multiple channels for generating and nurturing leads to qualified leads.
This model is not ideal for measuring sales or bottom-of-the-funnel interactions, because they receive no credit.
Time Decay
This model attributes contact credits more heavily to recent interactions. Credits are distributed using a 7-day half-life. This means an interaction 8 days before a conversion gets half as much credit as an ad interaction 1 day before the same conversion, for example.
Full Path
This model is available only in revenue attribution reports. This model attributes 22.5% of the deal revenue credits to the first interaction, lead creation, deal creation, and last interaction. It then attributes the remaining 10% of the deal revenue credits to all other interactions equally (i.e. middle interactions). Choose this model if:
-
You're equally concerned with all parts of the funnel and customer journey.
-
You're marketing and sales alignment is key to driving revenue.
-
You have a large marketing and sales organization, or you have multiple marketing and sales channels to drive conversion.
J-Shape
This model attributes 20% of the credit to the first interaction, and 60% to the conversion. The remaining 20% is spread across other interactions in the conversion path.
Choose this model if you want to give credit to both the first interaction and converting action but give more weight to the conversion.
Inverse J-Shape
This model attributes 60% of the credit to the first interaction, and 20% to the conversion. The remaining 20% is spread across other interactions in the conversion path.
Choose this model if you want to give credit to both the first interaction and converting interaction but with more weight on the first interaction.
HubSpot Hack: If it's the first time you're running an attribution report, start with either the first interaction or the last interaction attribution model so you can understand which campaigns or assets your contacts are really paying attention to before they convert to an opportunity.
Once you have decided which attribution model makes the most sense for your organization, you can run the report of deals by original source (as shown above).
4. WHICH MARKETING ASSETS ARE BRINGING THE MOST OPPORTUNITIES/CUSTOMERS?
You will also use attribution reports to evaluate which marketing assets are attracting the most opportunities and customers.
As a marketer, it's easy to fall into the trap of assuming that your audience wants more ebooks, more blogs, or another webinar, but can you prove this? When you pull the attribution report based on assets, you can back up your assumptions with data.
The report above shows the attribution report by revenue so that you can see which asset actually drove the newest revenue. Understanding which content generated the most revenue will help you (and your boss) decide which types of content you should be focused on in the next quarter or year.
5. WHICH TOUCH POINTS ARE WORKING BEST FOR ATTRACTING OPPORTUNITIES/ CUSTOMERS?
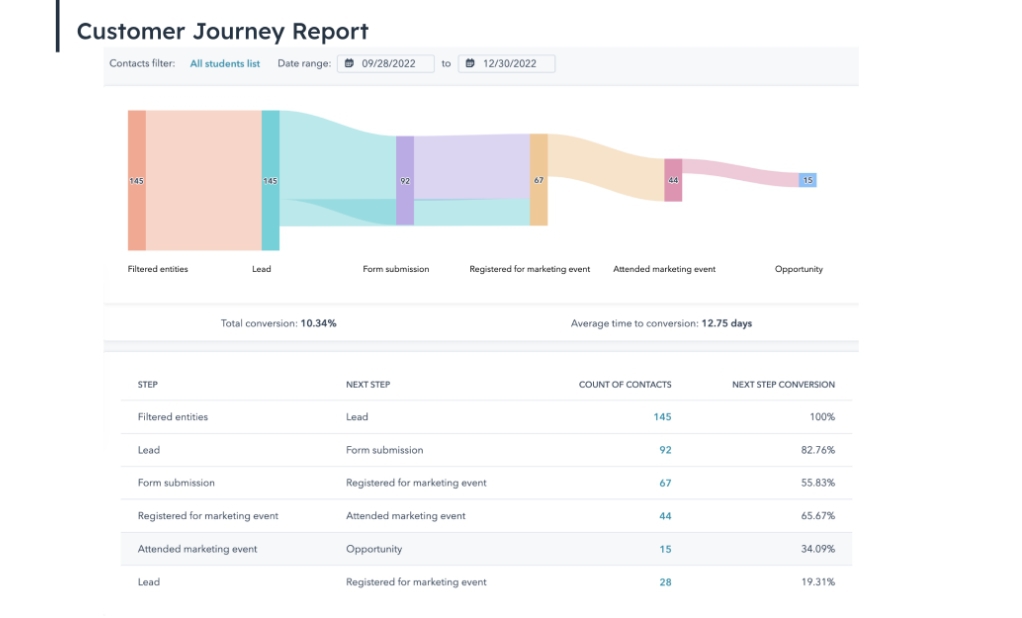
The last report you'll want to share with your boss is the Customer Journey Report. This report illustrates which touch points the contact interacted with before they became a customer, where your customers touched which assets, and the assets most effective in moving your contact down the funnel.
When you run this report you'll want to choose a small group of customers to see exactly what their buyer journey looked like. We recommend starting with one excellent customer and analyzing their journey. Then look for other customers who took a similar journey. Use that data to determine which parts of this customer journey are most likely to bring you the best customers. Finally, you can use these insights to figure out how you can start forcing leads to go through that journey.
Final Thoughts: Best practices when building Reports in HubSpot
- Know what question you're trying to answer so you know which fields to choose.
- Use the reports to fill out missing information in your data. You should not see too many values in the categories such as "No Value." So double check why this data is missing and fill it out.
- Use the data to examine your assumptions and plan accordingly. For example, if you have an inclination that summer months are slow months for sales, then use this time to meet with sales reps to determine how you can further assist them and create the collateral needed.
Need help running reports in HubSpot? Our team of Hubspot implementation experts can help you find the information you need
>> Set up a call with our sales team
and see if Penguin Strategies is right for you. <<