
Wouldn’t it be great to just “go with our gut” when making business decisions? I personally think it would be a lot more exciting. As much fun as that might be, I don’t think your clients or co-workers would be amused.
When you want to cook up something delicious, you follow a recipe. The quantities and processes through which you combine your inputs is directly related to what type of output you receive.
Even more so, before any recipe goes to print, it’s first experimented with and tweaked. More of one ingredient, less of another. See what happens if you substitute sugar for agave, etc. Well, it’s the same thing with Inbound Marketing. Analyzing data and tracking performance is crucial to your success.
But what data should you analyze? Where do you start?
First, try to pinpoint what is important for you to track. There isn’t a universal blueprint of how often you should write an inbound marketing analytics report or what metrics to focus on.
Each company should have a personalized report with data that is important to them. According to HubSpot, not all metrics should be treated equally. In fact, there are some metrics that should be tracked on a daily basis, others that require weekly analysis, and still others that demand monthly consultation and calibration.
In this blog I’m going to explain the 5 most important metrics to include in your monthly analytic reports. Start with these, make some adjustments, and repeat. In so doing, you should be able to shore up your weaknesses and maintain your strengths.
1. Social Media Exposure
Tracking the performance of your social media activities is extremely important in understanding its ROI. The quantity of messages created is less important than creating messages that yield interactions.
Try focusing on the number of clicks per message and compare that to previous months. This will give you a good indication of how your social media is performing and which social media platforms (Facebook, LinkedIn, Twitter etc.) you should focus on.
Here is a graph from HubSpot showing the total number of messages published, click per message rate, and overall interaction, over a months span.
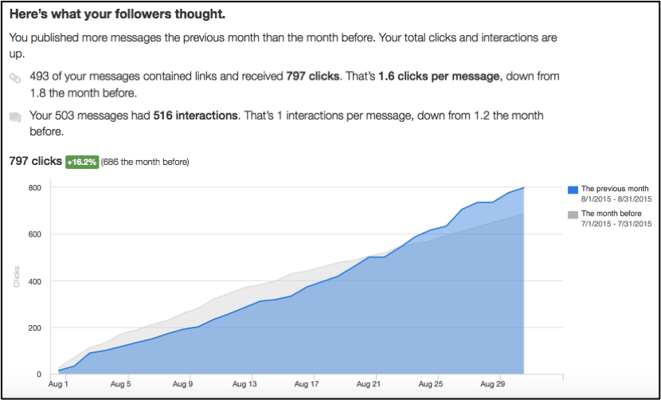
With these numbers, you can see where you were successful, and how to improve in the future. Take 2.0 clicks per message as an initial benchmark to work towards. If you achieve that, push the needle forward and aim for 2.5 clicks per message. Once you’ve figured out you’re secret recipe, replicate and refine it each month.
2. Blog Post Views:
Tracking the number of views that the different posts on your blog generate is hugely informative. Take a look at which blogs had the most views, and ask yourself to conjure up an explanation. It most probably has something to do with its topic, tone, depth of research, actionable information, SEO, or the social media campaign created to promote it.
If you have too many conflating variables, isolate whatever you can and A/B test the remaining variables going forward. As you publish more blog posts, be sure to methodically include, exclude, and augment the factors in question.
Don’t forget that your blog performance is affected by which keywords you choose. Besides using Google AdWords, try using Screaminfrog or SpyFu to analyze what keywords your competitors are using and to what effect.
3. Website Traffic Sources:
Don’t you want to know who came to your website, and better yet - how they found you? If you’re using a marketing automation platform, getting that information is a cinch.
If you’re not, you’ll have to use unique tracking codes in the links you distribute through your email and social media campaigns. With those codes, you’ll be able to see the breakdown of sources for your web traffic in Google Analytics.
To find the distributions for the different sources of your traffic in HubSpot, click on the “Reports” icon at the top of your screen.
When the dropdown menu appears, select “Sources”. You will be redirected to a page graphically representing the number of visits to your site, and from what source they arrived.
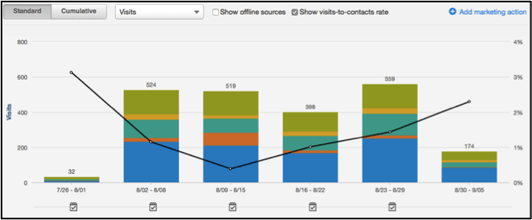
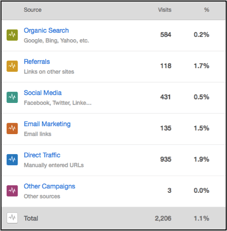
Understanding these values will help you see which marketing campaigns have the greatest ROI. By determining your strongest marketing channels, you are able to see if you’re putting the right amount of effort into each channel. If your returns aren’t high enough, switch up your tactics for the next month.
4. Email Click Through Rates:
When you send an email to a bunch of people, you don’t care about how many people opened your email, but how many clicks were received on whatever your email was promoting.
Once you realize which emails performed the best in terms of clicks, ask yourself the magic question:Why?
Similar to your blog posts, take a look at the tone, language and body of the email.
What exactly were you promoting? Did it differ greatly from previous emails sent? Was your CTA visible and understandable? Being aware of these details helps you understand what your audience wants to read.
5. Leads/Prospects Gained:
This is one of the most important metrics for marketers to focus on. After creating a large amount of content, you want to see the percentage of people who actually turn into contacts.
The main way this conversion happens is through the different landing pages that you’ve created. Looking at the conversion rates of landing pages, shows the number of leads you’re generating.
Which landing pages boost the highest conversion rates, views, and overall performance.
Ask yourself: What content did I use? Where did I promote this landing page? Is it personalized for my audience?
Answering these questions is the first step in analyzing what makes one landing page more successful than others.
Take that knowledge, and go make some great content!
Writing a monthly analytics report is easy. Analyzing the data and implementing change in your company is hard. But if you realize the importance of constantly making changes based previous decisions, you’re guaranteed to increase overall performance and conversion rates in the future.
Once you’re done with these metrics, jot down 3-5 goals you want to complete for next month. This could include, increasing blog posts, creating more premium content, targeting thought leaders etc.

by The Penguin Team on September 17, 2015
As a leading B2B digital marketing agency, We help B2B Technology Companies, enterprise software, and hardware companies increase brand awareness, reach more qualified leads and close more customers. Penguin Strategies is a Diamond Partner of HubSpot.