
It’s the end of the month, and you are preparing your reports of marketing and sales activities from the past month. How many website visitors became leads, what channels did they convert on, what content did they download or interact with the most, did sales open more deals than last month, and how many of them became customers?
While you can present your KPIs in a customized HubSpot Dashboard, there are some missing pieces to the puzzle.
Attribution. Attribution reports fill in the gaps of your customer journey from when a website visitor steps into your website, converts on a form, opens a deal with a sales rep, and finally becomes a customer. They are able to tell you which of your marketing and sales activities have contributed the most or the least to your business.
For a long time, marketers have longed for this feature and HubSpot took notice. If you are looking for evidence that your marketing content is bringing quality leads or that your social media campaigns are kicking butt, it is time for you to get started with these revenue attribution reports.
What exactly IS Revenue Attribution?
So let me explain. Revenue attribution gives credit to marketing and sales events that a lead takes on their journey to becoming a customer. For example, a revenue attribution report can show the last interaction the lead had before signing the deal as the main trigger for the won deal.
In this case, this is usually a big win for the sales team since they are usually the ones who make the last call. But that can leave marketing out high and dry. What about the weekly blogs, carefully drafted eBooks and on-going webinars?
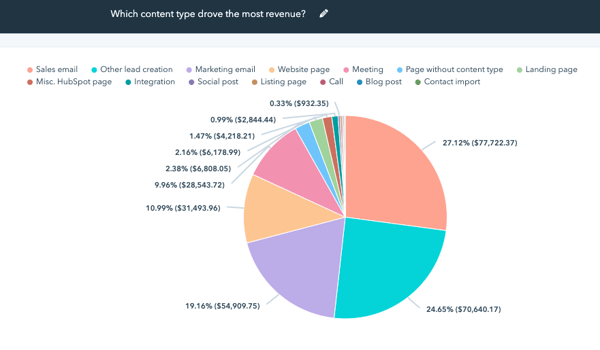
Don’t worry. Multi-touch revenue attribution looks at an entire sequence of website engagements, letting you decide how you want to divide conversion and revenue credit. It provides insights on the impact of your campaigns, individual landing pages, marketing emails, website pages, and blogs that your customers have engaged with, to help optimize your marketing strategy and build better campaigns.
Tell me more!
So you are probably wondering how revenue attribution works and what exactly can we see with it?
Well, let’s start with the first part. Multi-touch revenue attribution connects your end to end customer journey back to your closed deals in HubSpot. It works by looking at those key conversion points, also known as interactions, and attributes credit based on the attribution models.
You can apply multiple attribution models to get a good look at what activities are working and what is not as well as to get different perspectives.
HubSpot will look at your closed deals and the contacts associated with those deals. If the “Amount” property is filled and has a closed date, revenue is credited to the different interactions associated with the deal’s associated contact.
That said, it is very important for your sales to connect the relevant contacts with your deals, in order to gain full insight. Since you might not consider every interaction equal, the tool allows you to decide how to allocate the credit. Here is how they break it down:
- First Touch Attribution: This model attributes 100% of the credit to the first conversion, and is helpful for identifying the value of your top of the funnel content, which drives visitors to your site for the first time.
- Last Touch Attribution: This model attributes 100% of the credit to the last interaction before the deal was closed-won. This model is closely tied to activities at the bottom of the funnel such as sales activities.
- Linear Attribution: This model splits the credit equally across all interactions in your funnel, from top to bottom, giving you insights into what contributed the most to your revenue from your customer’s journey.
- U-Shaped Attribution: This model attributes credit to the top half of your funnel, heavily focusing on marketing activities. To break it down further, 40% of credit will go to the first interaction, 40% to lead creation, and the remaining 20% is split equally among all other interactions between them. This report will help you identify the content that generates leads who become customers, in other words, high quality leads.
- W-shaped Attribution: This model also focuses mainly on marketing efforts but includes the activity of deal creation, giving acknowledgement to the marketing and sales hand off. To break it down, 30% of credit goes to each of the first conversion, lead created, and deal created interactions, while the remaining 10% is split equally among all interactions in between.
- Full-Path Attribution: The last model gives 22.5% of credit to each of the 4 ‘major’ interactions; first conversion, lead creation, deal creation, and deal closed-won interactions. Hence the name, this solves the problem of what drives visitors to my site and what leads them to eventually sign deals.
The only way to get insights is to see it for yourself
 Regardless if you have just submitted your monthly report or are about to prepare it, now is the time to head over to your Reports and start testing and creating your own Attribution Reports.
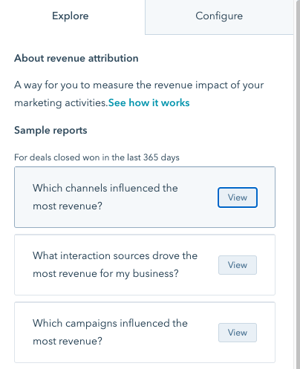
If you’re new to attribution reports, I suggest playing around with the pre-made reports available in the Explore tab.
Let’s say you wanted to see which channel influenced the most revenue. This will give you insight into which channel impacted the business most, based on attribution models, Linear and Full path.
There are several more to get you familiar with the tool. Don’t forget to look below the graphs for the option to drill down further and see even more insights in detail.
Once you are comfortable, head over to the Configure tab to start creating your own reports and viewing them through different attribution models.
- Choose a chart type
- Filter by the Deal Closed date time frame that you want to cover.
- Select the content type or choose All if you want to compare all
- Select the Dimension type
- Attribution model
You did it! You now understand and are able to show how your marketing and sales activities are creating revenue for your business.
Your team will be excited to see this, so go and save these reports to your Marketing dashboard or as a stand-alone report for later.
Don’t forget, if you ever need some quick tips or tricks about setting up dashboards, don’t hesitate to reach out.

by Gabi Yanover on July 15, 2020
Gabi is the Director of Implementation Team at Penguin Strategies. She is passionate about yoga, traveling, and Marketing Tech solutions.