
In the dynamic world of business, achieving success requires a strategic and data-driven approach. Highly successful companies possess certain habits that set them apart from the rest.
Peter Caputa, CEO of DataBox recently joined us in our Hubspot Hacks series to discuss the findings from DataBox's 2023 State of Business Reporting. Check out the full conversation:
Here are the 7 Performance Management Habits of Highly Successful Companies that Caputa and his team identified in their research:
1. They Track The Right Metrics
The Databox survey found that the companies that outperformed the sample were much more confident in the metrics they were tracking.
Successful companies knew they were tracking the right stuff, whereas less-successful companies were unclear. Specifically, 69% of the highly successful companies surveyed reported that they were very confident they were tracking the right metrics, whereas only 49% of the entire sample felt confident they were tracking the right metrics.
Many companies really struggle to identify which data is important to track and which are inconsequential or vanity metrics.
Businesses operate in diverse industries with unique operational models, target markets, and goals. Therefore, metrics that prove valuable for one organization may not necessarily hold the same significance for another. Determining the right metrics requires a deep understanding of the company's objectives, strategy, and industry dynamics. It demands an evaluation of both quantitative and qualitative factors, making the process intricate and multifaceted.
Databox found that the most successful companies re-evaluate which metrics are important at least once a quarter. They regularly ask themselves:
- Are we tracking the right KPIs?
- Should we be drilling down a little bit differently?
- Should we be capturing data a little differently so that we can analyze it differently?
Regularly reconsidering your KPIs can help you make sure your data analysis keeps up with changes within your organization.
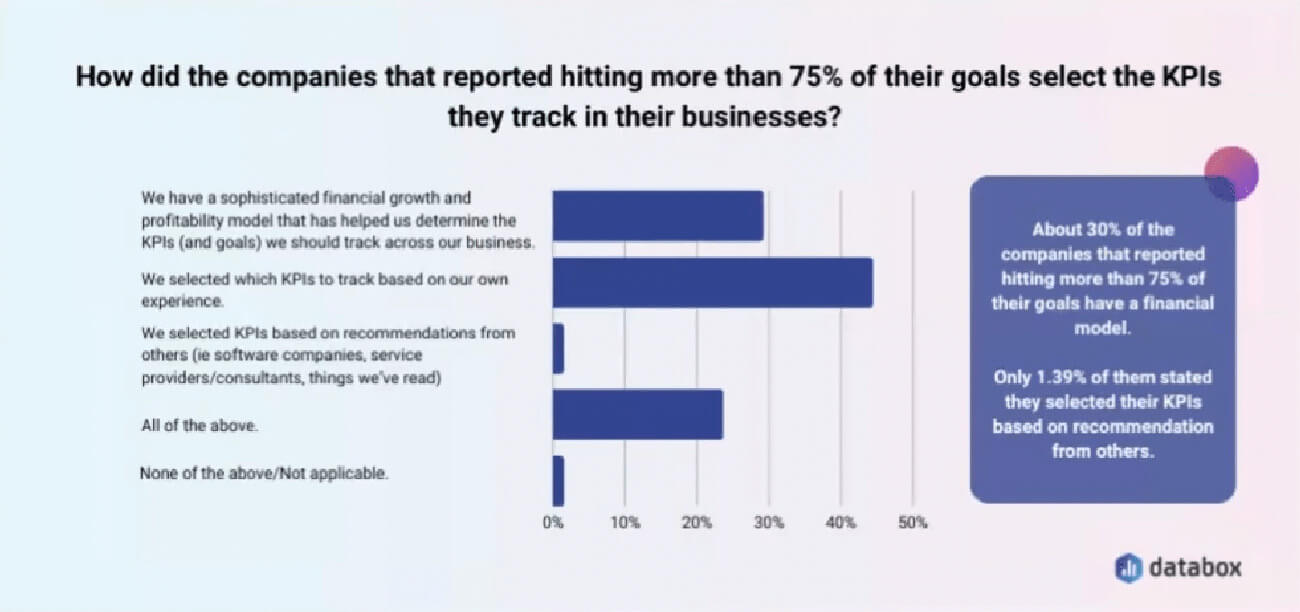
2. They Have A Financial Model
Among the habits of highly successful companies, having a well-developed financial model stands out as a critical factor. A financial model is a tool that enables organizations to analyze and project their financial performance, aiding in decision-making, planning, and strategic execution.
Advice: Caputa explained that you have to put some time into the math that says, “If we do X, we can expect Y.” Whether that's growing your revenue or growing your margins, it's important to whip out a spreadsheet, and put some of your historical data in there, project forward, and try to figure out where we can end if we invest in certain things."
The survey found that the top-performing companies all had a financial model that they used to facilitate strategic decision-making.
By modeling different scenarios and analyzing their financial implications, these companies routinely evaluate the potential outcomes of various strategies or business initiatives. This allows them to assess the financial viability of new product launches, expansions into new markets, investment decisions, mergers and acquisitions, and other strategic moves. With a comprehensive financial model, companies can make informed choices based on a thorough understanding of the financial impact.
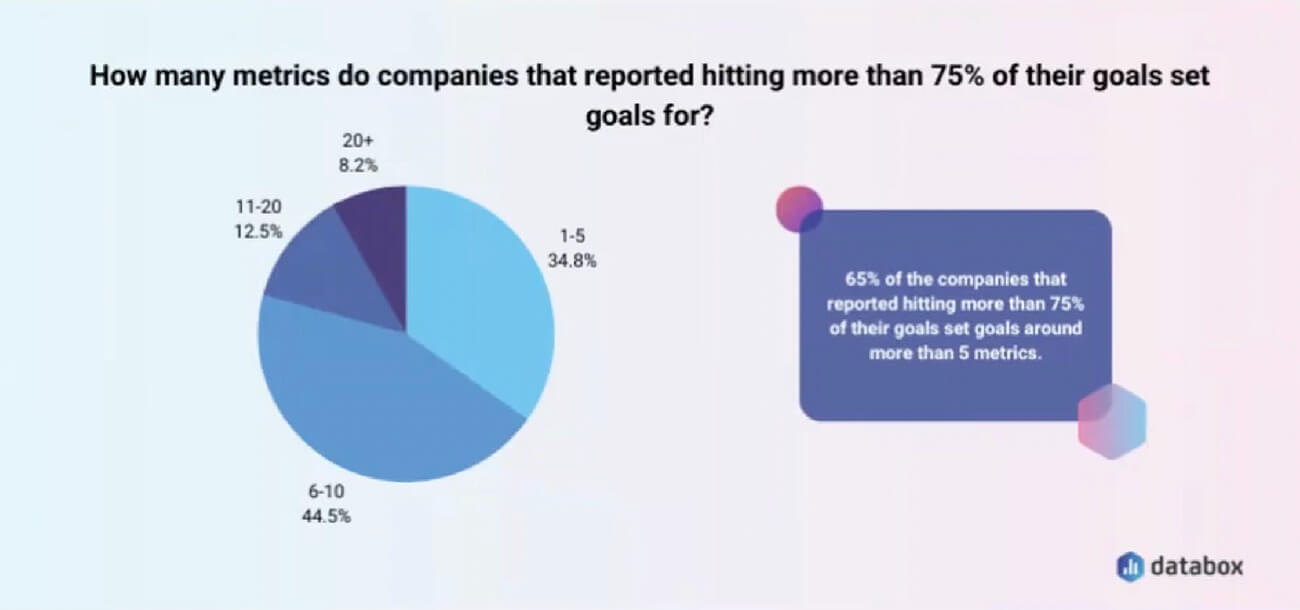
3. They Set A Lot of Goals
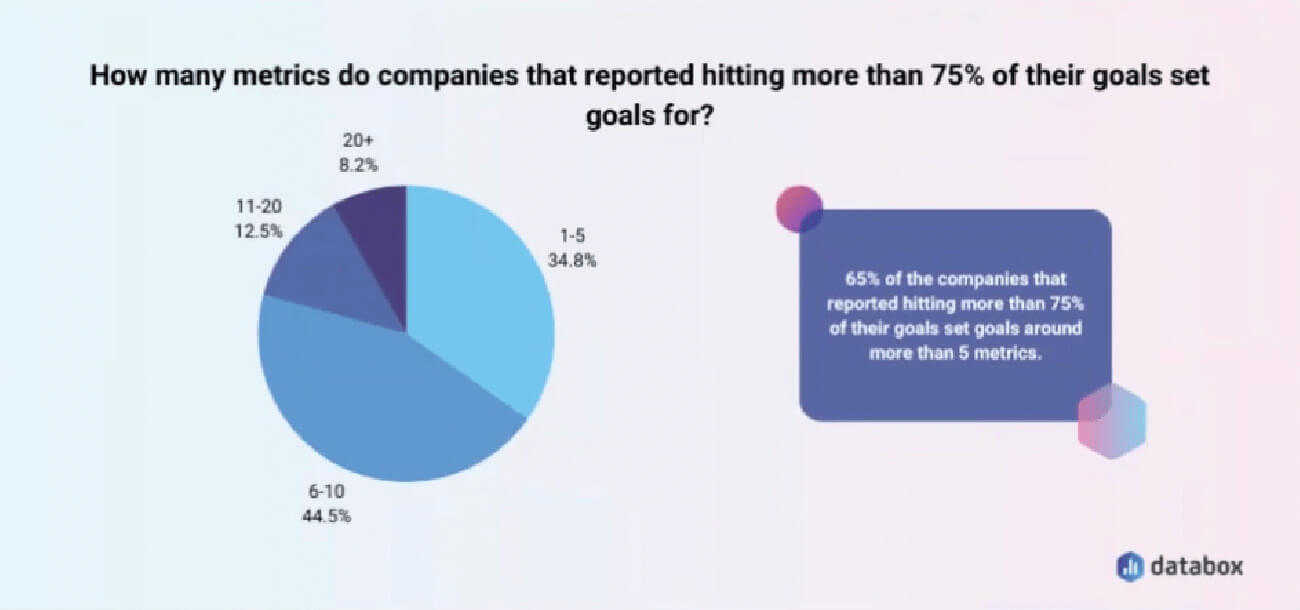
The third habit that Databox observed in successful companies is that they tend to set a larger number of goals.
Caputa explained, "There’s somewhat dated advice out there that you should only have a small number of goals in your business. In reality, you should probably have, depending on the size of your organization, tens, maybe hundreds of goals. And every person in your organization should be focused on improving some metric."
Advice: We recommend setting 3-5 top-level goals and then identifying smaller goals that feed into them. For example, if you have a top-level goal of increasing revenue by 10%, you could break down that goal into a number of new deals you need to close. You also need to figure out what activities lead to that deal being created and closed that will ultimately influence those closed deals. A lower-level goal could be increasing the average revenue per closed deal. That, in turn, breaks down further into goals for product demos, new leads generated, or website traffic volume. Things like the number of published blog posts or recording a certain number of videos for LinkedIn can all be goals.
Pro Tip: Goals should always be S.M.A.R.T- Specific, Measurable, Actionable, Realistic, and Time-Bound.
4. They Monitor Performance Daily & Meet to Review
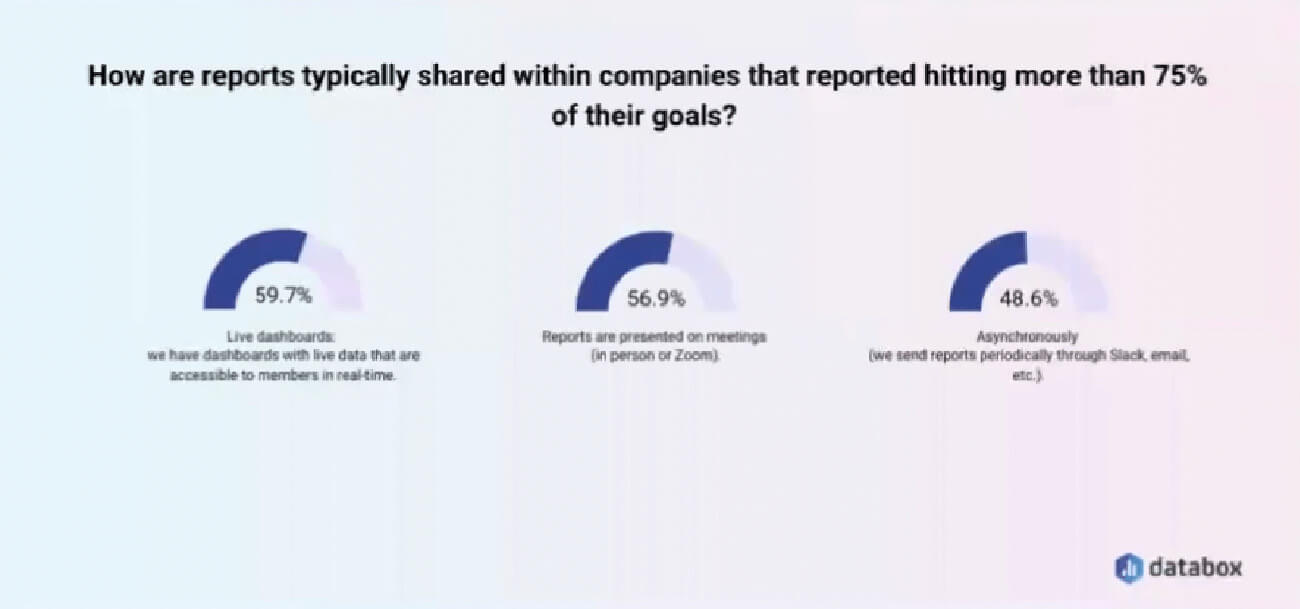
Fourth, about 60% of high-performing companies share their reports via live dashboards compared to 52% of the entire sample in the Databox survey. Live dashboards mean that everyone in the company has their eye on the prize in real-time when it comes to their goals.
Most of the successful companies surveyed reported that they use both a common dashboard that is shared across the company as well as team-specific dashboards that allow them to monitor exactly how they're performing. That way, they can spot things on a daily basis and course correct.
They also review their reports in meetings. About 60% of these top performers use regular meetings to discuss their performance, hold people accountable for the numbers compared to their goals, and discuss ways that they can either hit the goal or improve further.
Advice: We suggest setting quarterly goals and plans, breaking them down into monthly goals, and scheduling a monthly or weekly meeting to review your progress toward your goals.
5. They Monitor and Report Results for All Key Functions
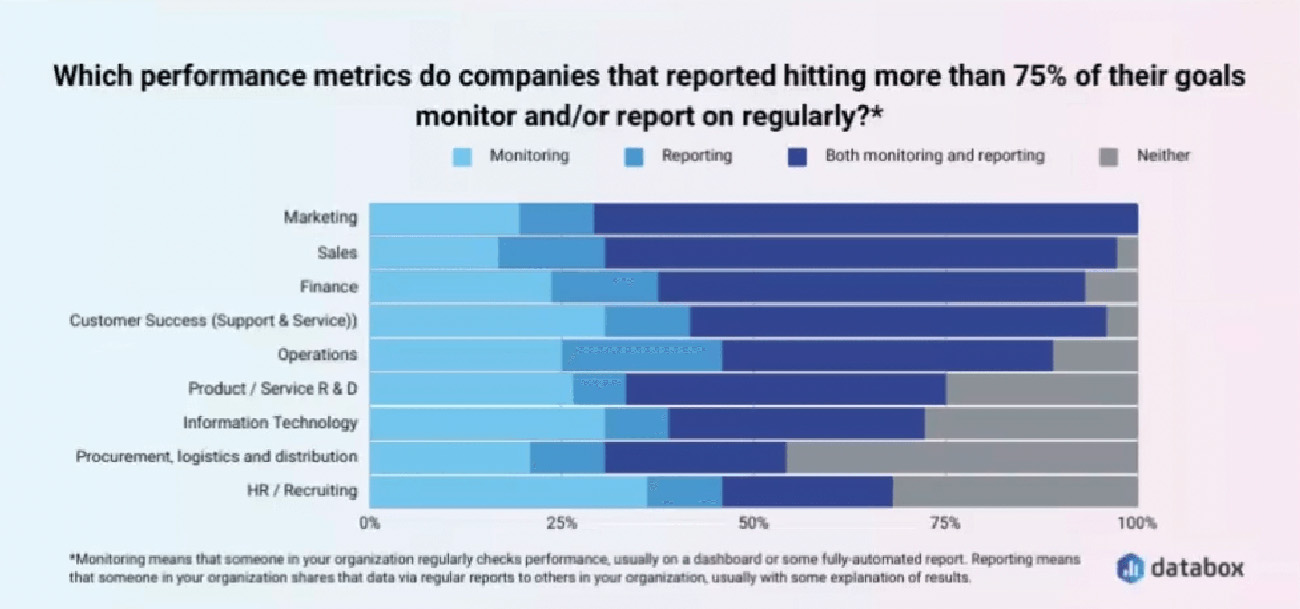
Because businesses are complex, you should be monitoring and reporting on a wide range of metrics that capture all the key functions within your business.
95% of the top performers in the Databox survey reported that they monitor and report on marketing, sales, customer service, and financial data. About 75% also monitor and report on Operations, Product/service R&D, and IT.
Databox also found that in the last 10-15 years companies have moved away from just reporting data to either monitoring more frequently or monitoring and reporting. This helps companies be more nimble and make adjustments as soon as the data reveals a problem.
6. They Report Results Frequently
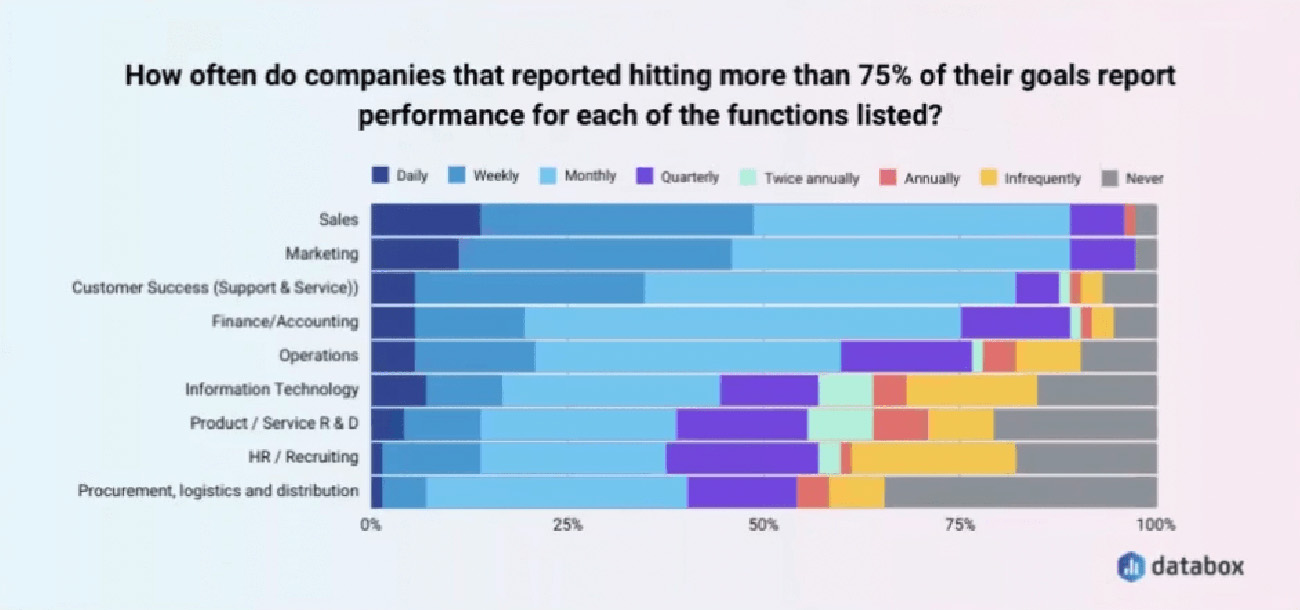
The top-performing companies are reporting much more frequently than the entire sample. Over 75% of the more successful respondents said they report on Sales, Marketing, and Customer Success at least once per month.
Many companies produce reports on a daily and weekly basis as well. Caputa says that " Our most successful customers, and I think they're probably at the extreme of data-driven organizations, are monitoring their data at least four times a week."
But the right frequency can be different based on your business.
If you are the type of business that closes four $1 million deals a year, you probably don't need to check your revenue numbers 10 times a day. On the other hand, if you are closing 10 or 100 transactions a month, then it's important to look at your results more frequently.
7. They Create Comprehensive Reports
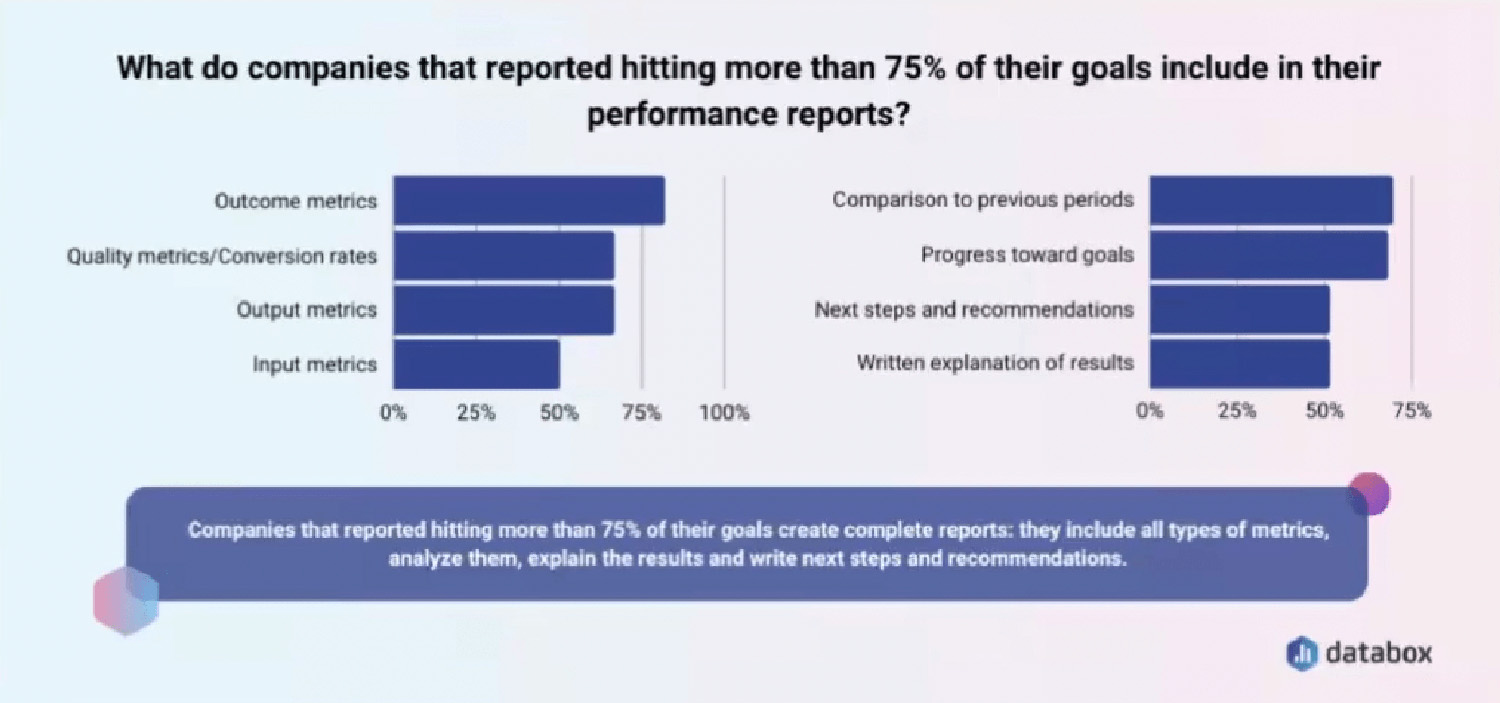
Finally, the last performance management habit of highly-successful companies is that they create comprehensive, thorough reports. The majority of top performers create reports that include a variety of metrics (inputs, outputs, outcomes, quality) as well as written explanations for the results, next steps, and recommendations.
It can be easy to get overwhelmed by all the data your organization produces. It can be hard to make sense of your data if you are looking at lots of different metrics, especially if you really don't intimately understand what the metric means, how you influence that metric, or how metrics are related.
Databox approaches this problem by creating a framework for trying to bucket metrics into the following categories:
- Outcome Metrics: the result you produce from your work. It could be revenue, number of deals closed, new leads generated, or web traffic.
- Quality Metrics: indicate the quality of your work. These are most often conversion rates. They are an indication of whether the things that you're doing are actually producing results for you.
- Output Metrics: Measure the quantity of your work. These could be the number of blog posts published, the number of customer support tickets resolved or the number of sales calls made.
- Input Metrics: measure the results of investments that executives generally control. It could be how much you invest in paid ads or headcount to a specific team.
By bucketing metrics into these three categories, companies can think of their organization as a system. This allows you to ask yourself:
- What investments are we going to make?
- What activities are we going to do?
- How do we know the quality of the work is high?
- And what are our results?
To thrive in today's competitive landscape, tracking the right metrics provides a foundation for informed decision-making and efficient resource allocation. Setting a multitude of goals, both top-level and smaller ones, ensures a comprehensive focus on improvement throughout the organization. Regularly monitoring performance through live dashboards and conducting review meetings helps identify issues promptly and implement necessary course corrections.
Reporting frequently and creating comprehensive reports by categorizing metrics into outcomes, quality, and inputs, allows for a thorough understanding of the organization's performance. Embracing these habits sets the stage for long-term growth, adaptability, and success in an ever-evolving business landscape.